Eight graphs that tell the story of U.S. economic inequality
Rising economic inequality over the past 40 years has redrawn the U.S. wealth and income landscape, shifting many of the gains of prosperity into the hands of a smaller and smaller group of people and marginalizing members of vulnerable communities. This transformation is in turn reducing income mobility and opening gulfs in educational achievement and health outcomes between different levels of income. The eight graphs in the three sections below visually illustrate these findings.

Inequality is rising
The first graphic tracks the share of all earned income accrued by the top 1 percent of earners, along with the next 9 percent, the upper 40 percent (from the 50th percentile to the 90th) and the bottom 50 percent. The share of income controlled by the top 10 percent bottomed out in the 1970s but has reached new highs—the top 10 percent of all income earners now control around 38 percent of national income. (See Figure 1.)
Figure 1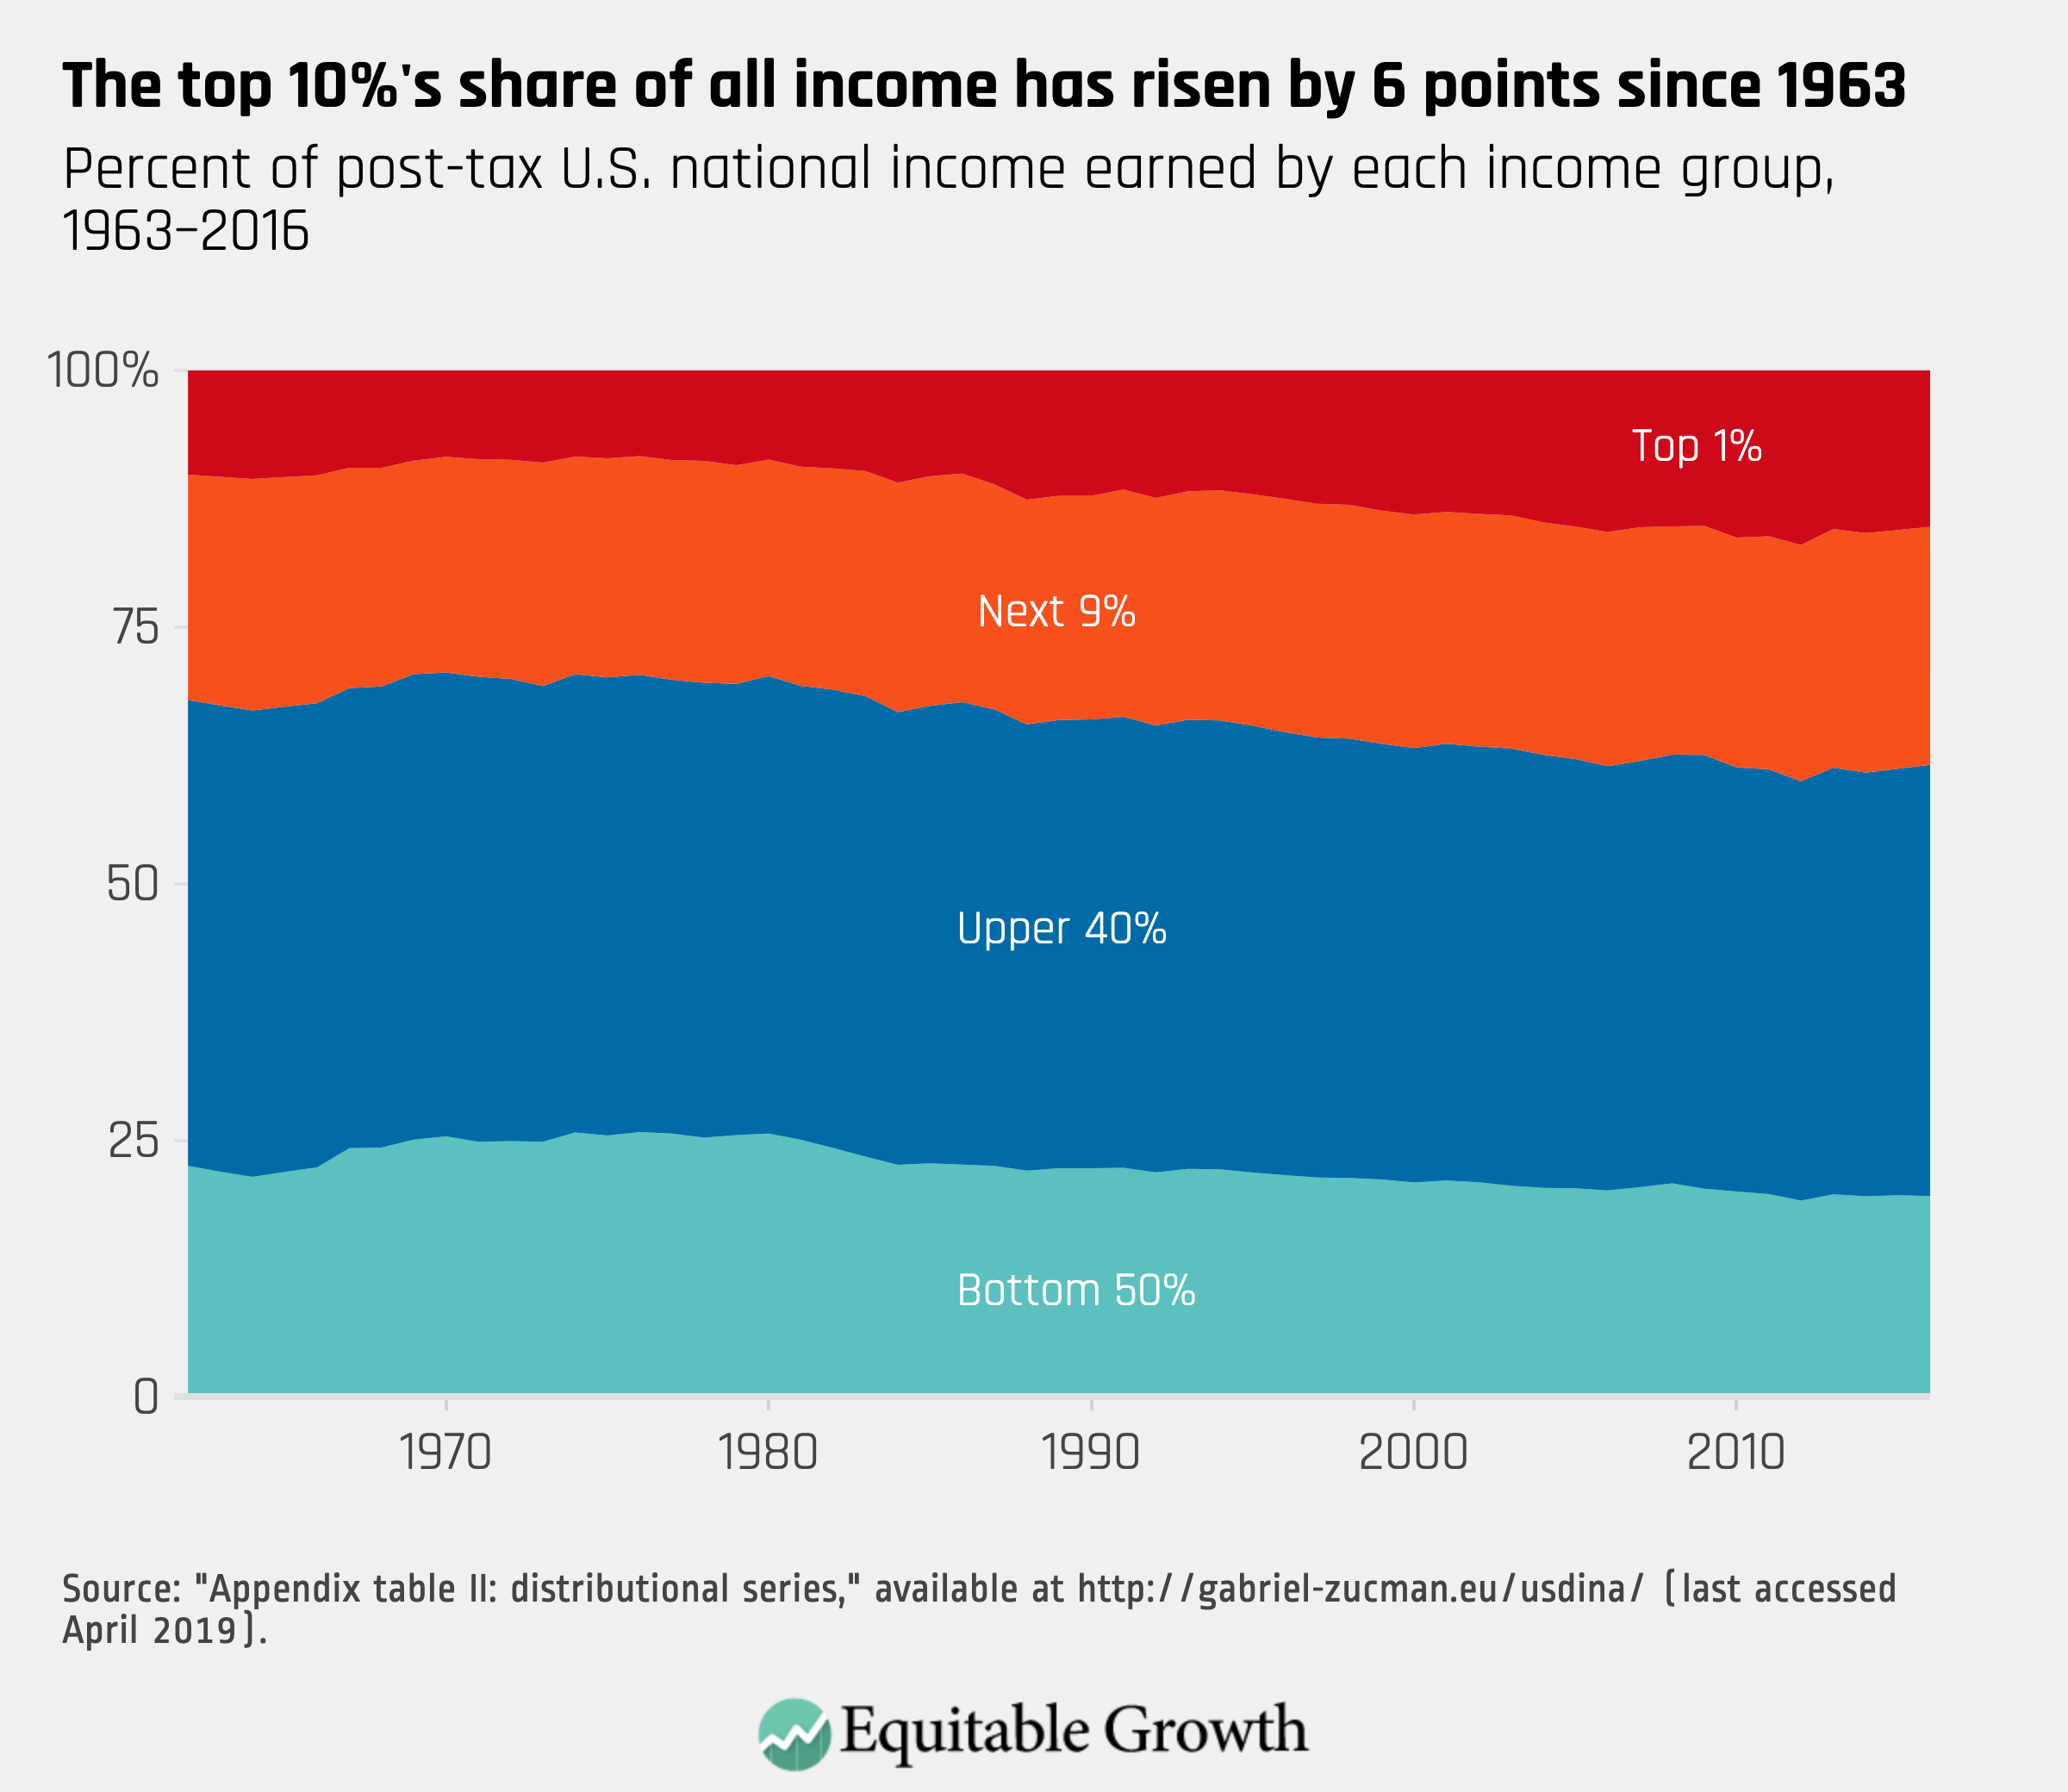
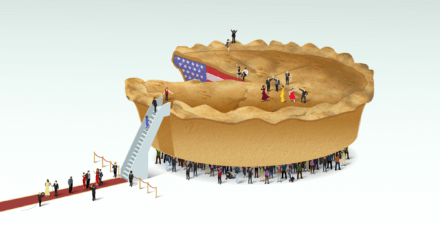
Wealth concentration has risen even faster. The wealthiest 10 percent of households have long controlled more than 50 percent of all wealth, but that proportion has grown steadily over the past two decades, according to new research from economists at the Federal Reserve. Just 1 in 100 Americans now own 31 percent of all wealth in the country, and the top 10 percent owns 70 percent of all wealth. Meanwhile, one half of Americans with the lowest wealth have paltry assets: just 1.2 percent of the total. (See Figure 2.)
Figure 2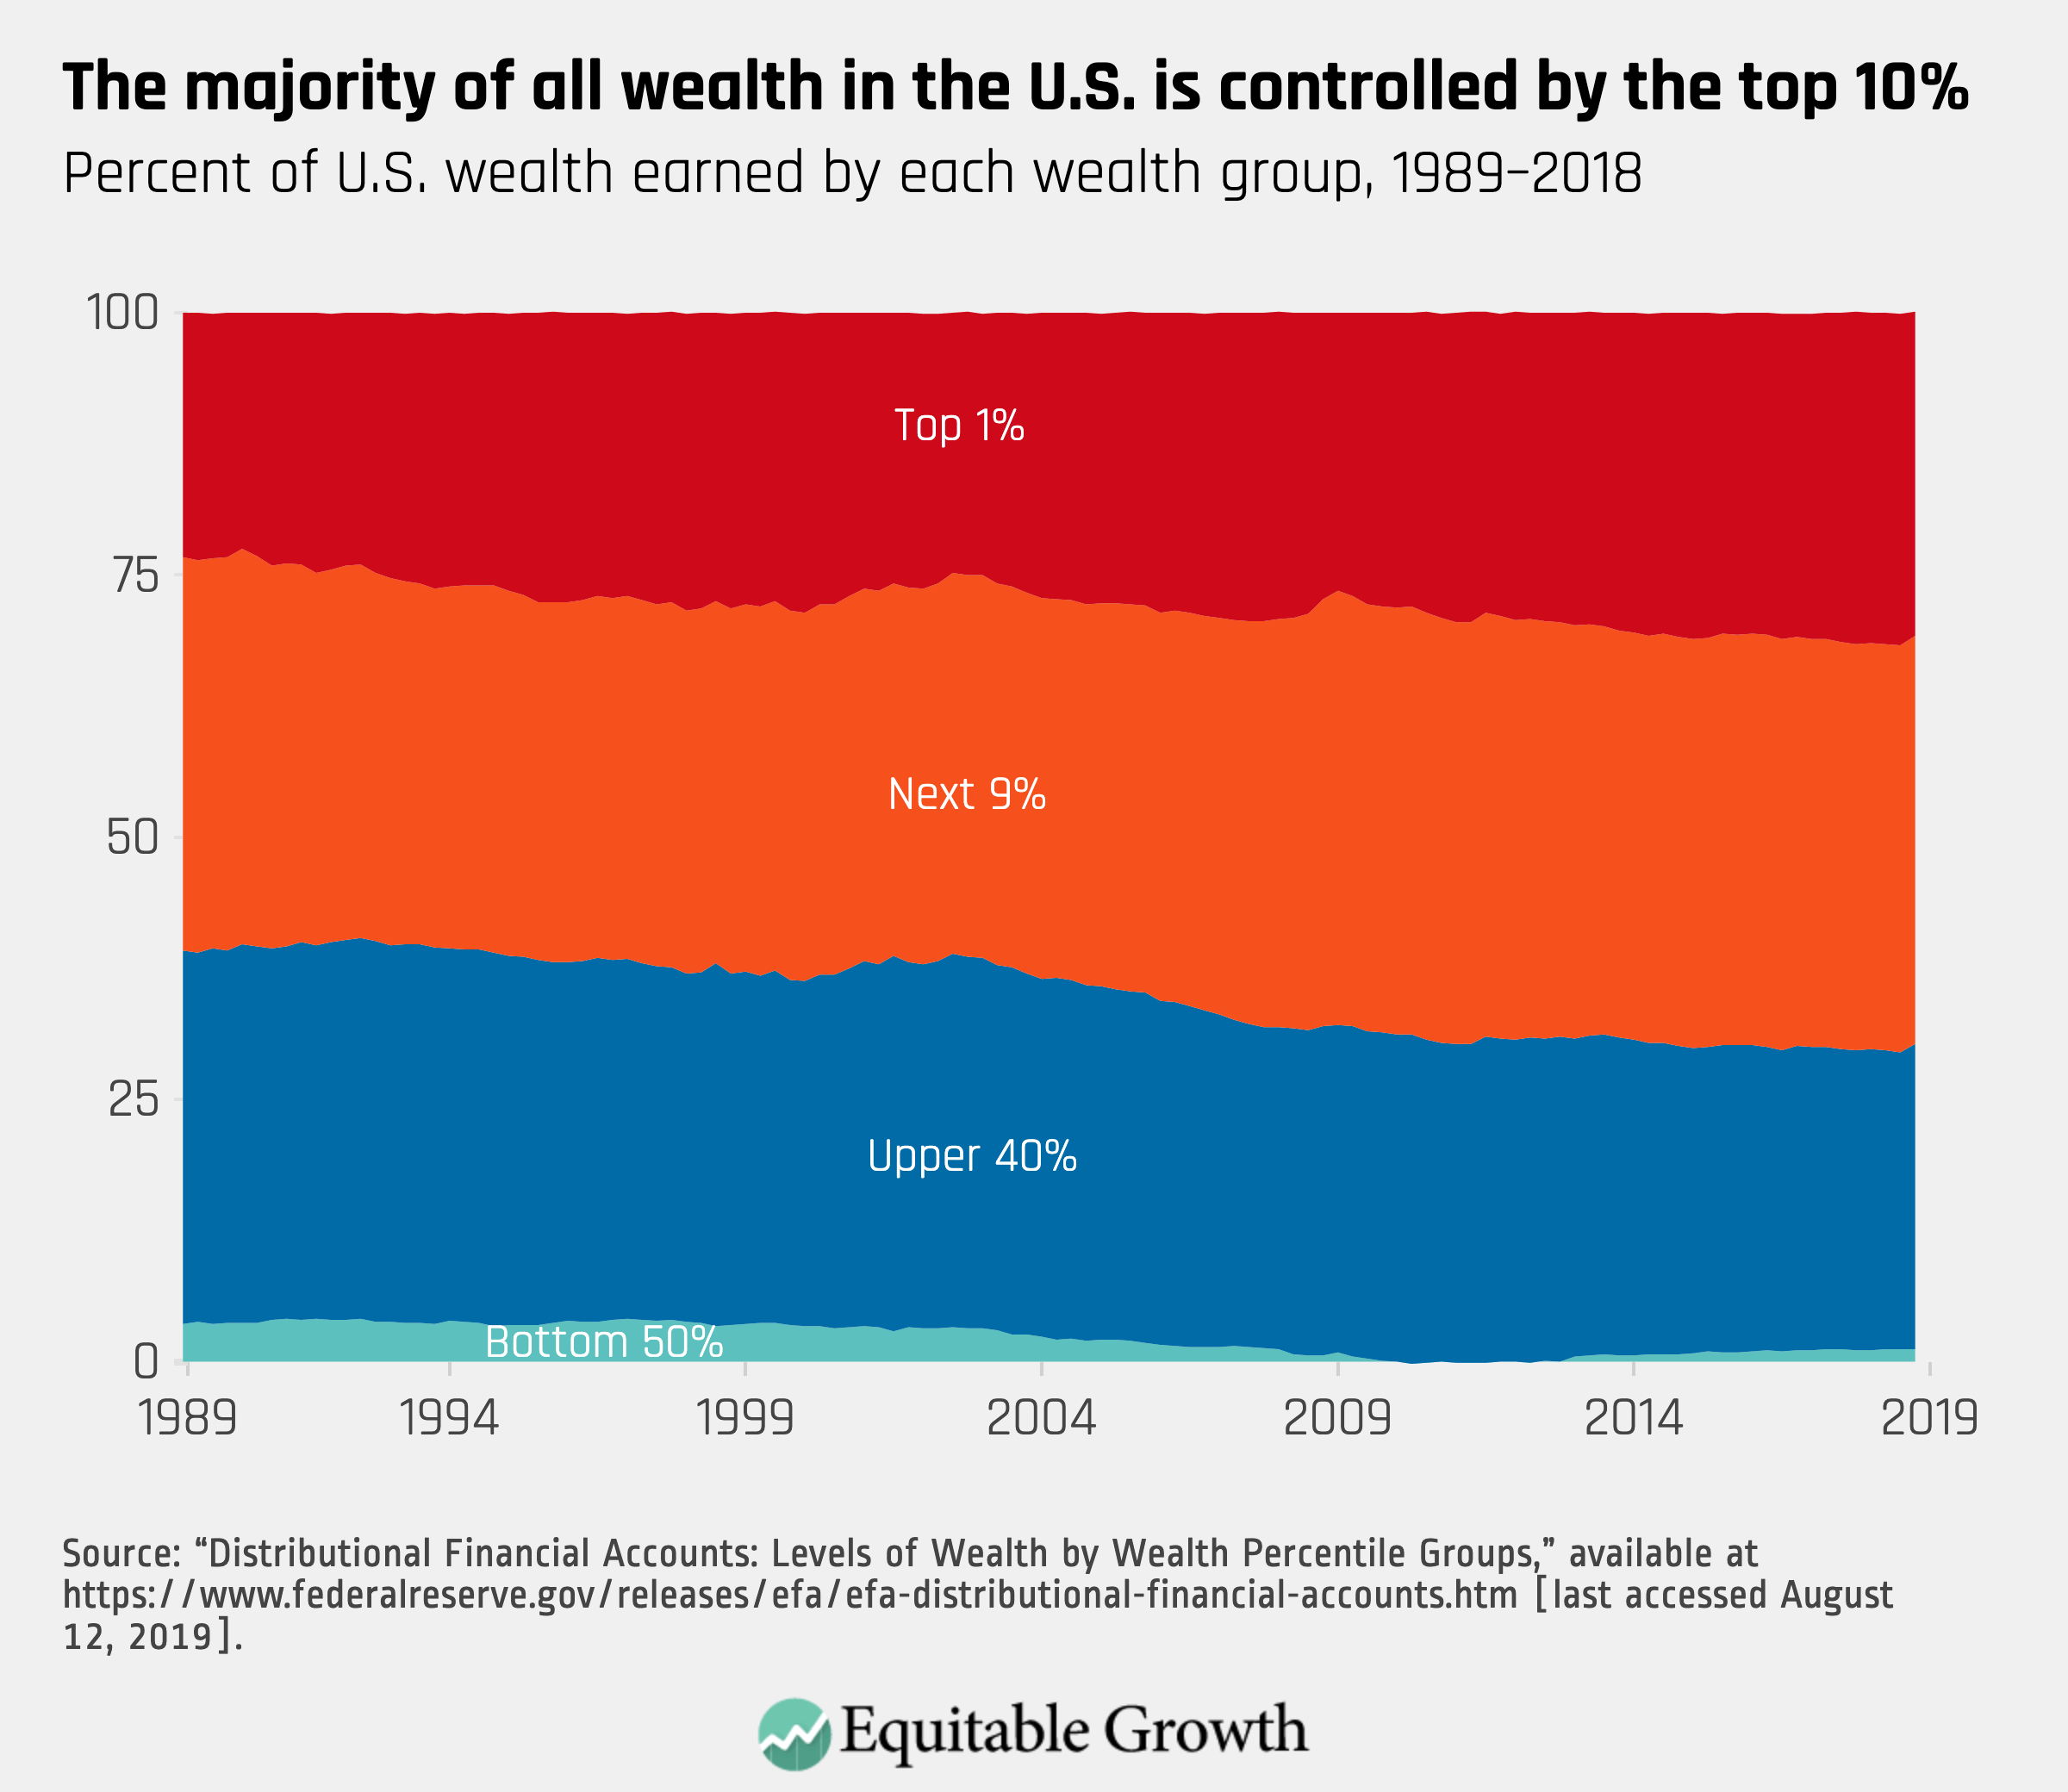
To some extent, these patterns are evident in other countries, suggesting that there may be global effects that explain some portion of the rise in inequality. But the rise in the United States has been much steeper than in Europe. (See Figure 3.)
Figure 3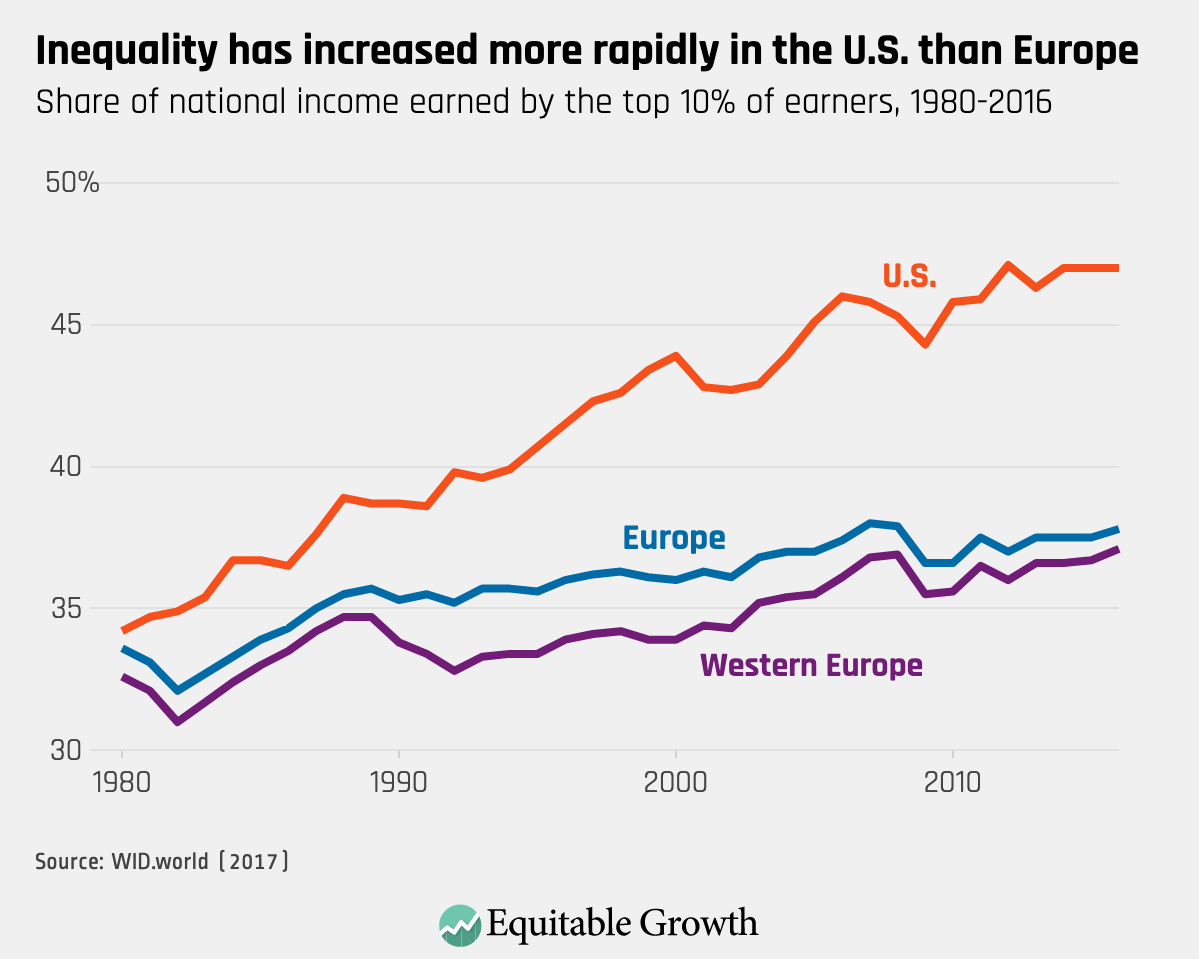
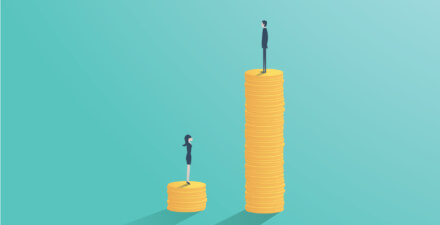
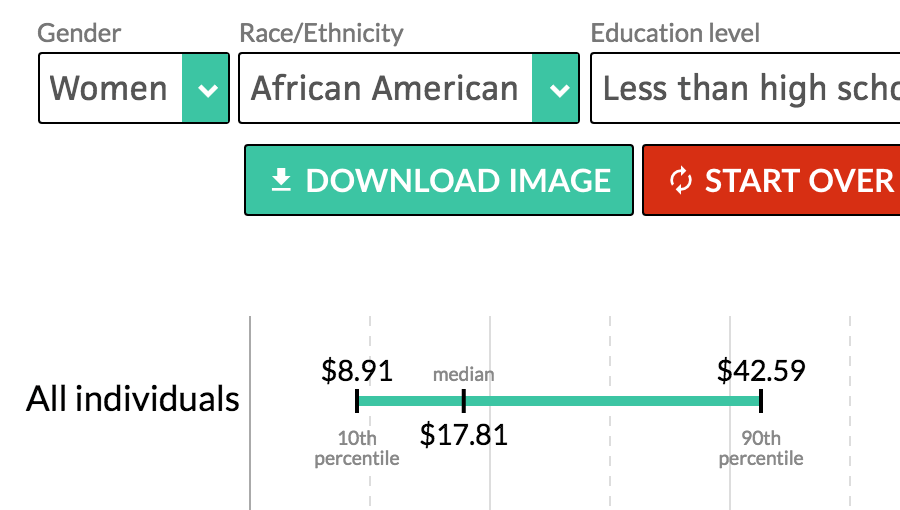
Underlying these broad income inequities in the United States is long-standing and ongoing racial inequity that results in people of color, and especially women of color, having lower salaries than white and male workers at similar levels of education. Not all of this gap is due to discrimination, but significant portions of it remain unexplained and are generally attributed to discrimination. (See Figure 4.)
Figure 4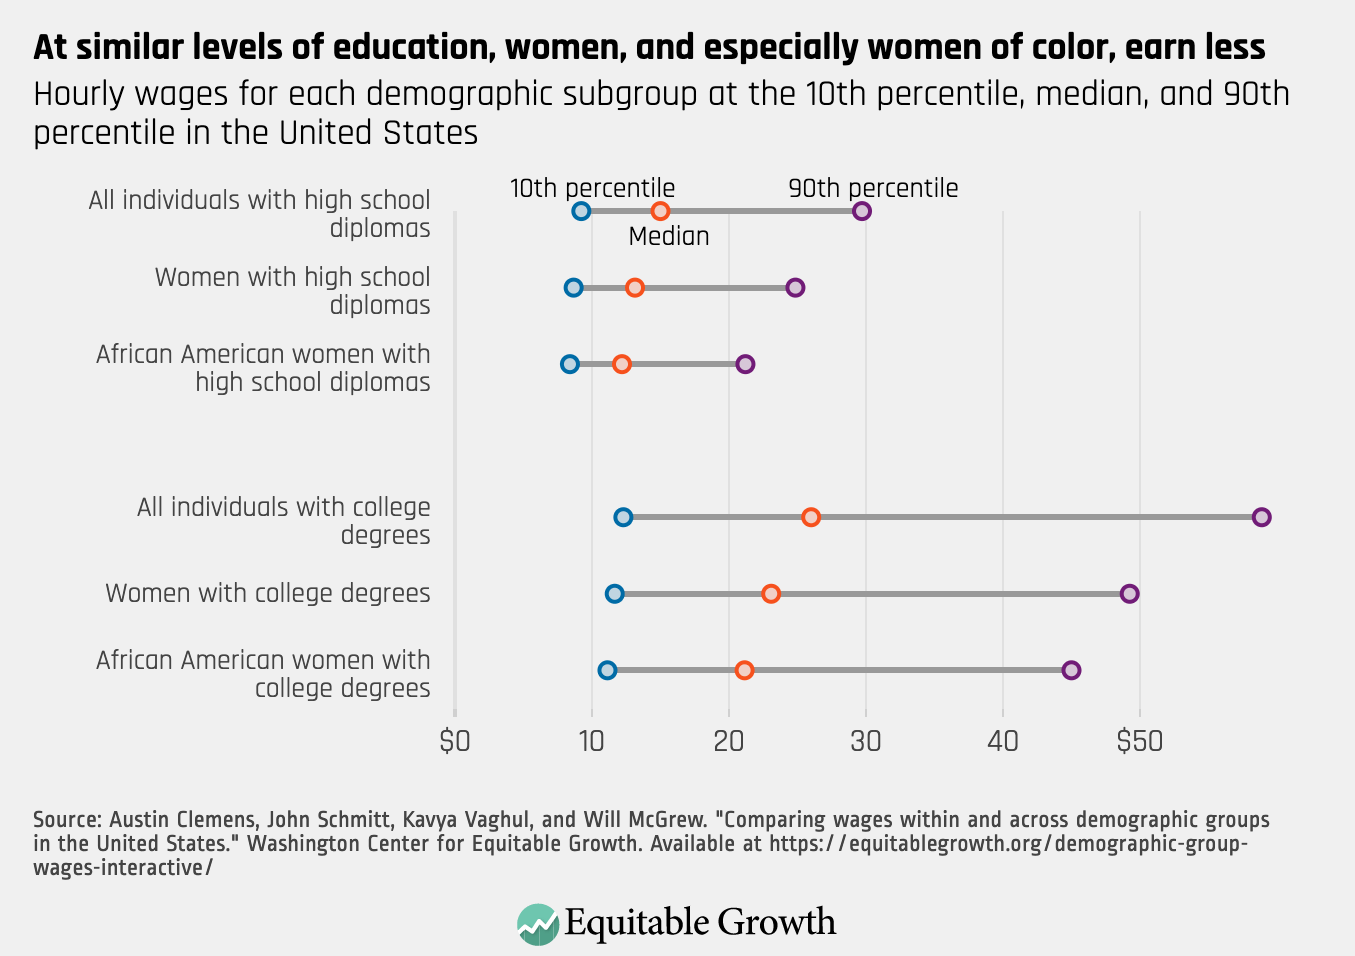
Mobility is decreasing
Patterns of economic growth that increase income inequality also make it more difficult for people to pull themselves up the rungs of the income ladder. Research by Raj Chetty at Harvard University and his co-authors shows that rates of absolute intergenerational inequality have crashed in the United States. At age 30, people born in 1940 had an approximately 90 percent chance of out earning their parents. But for people born in 1980, the chances were just 50 percent. Chetty’s research shows that most of this decline is attributable to inequity in income gains, rather than lower rates of growth over the latter period. (See Figure 5.)
Figure 5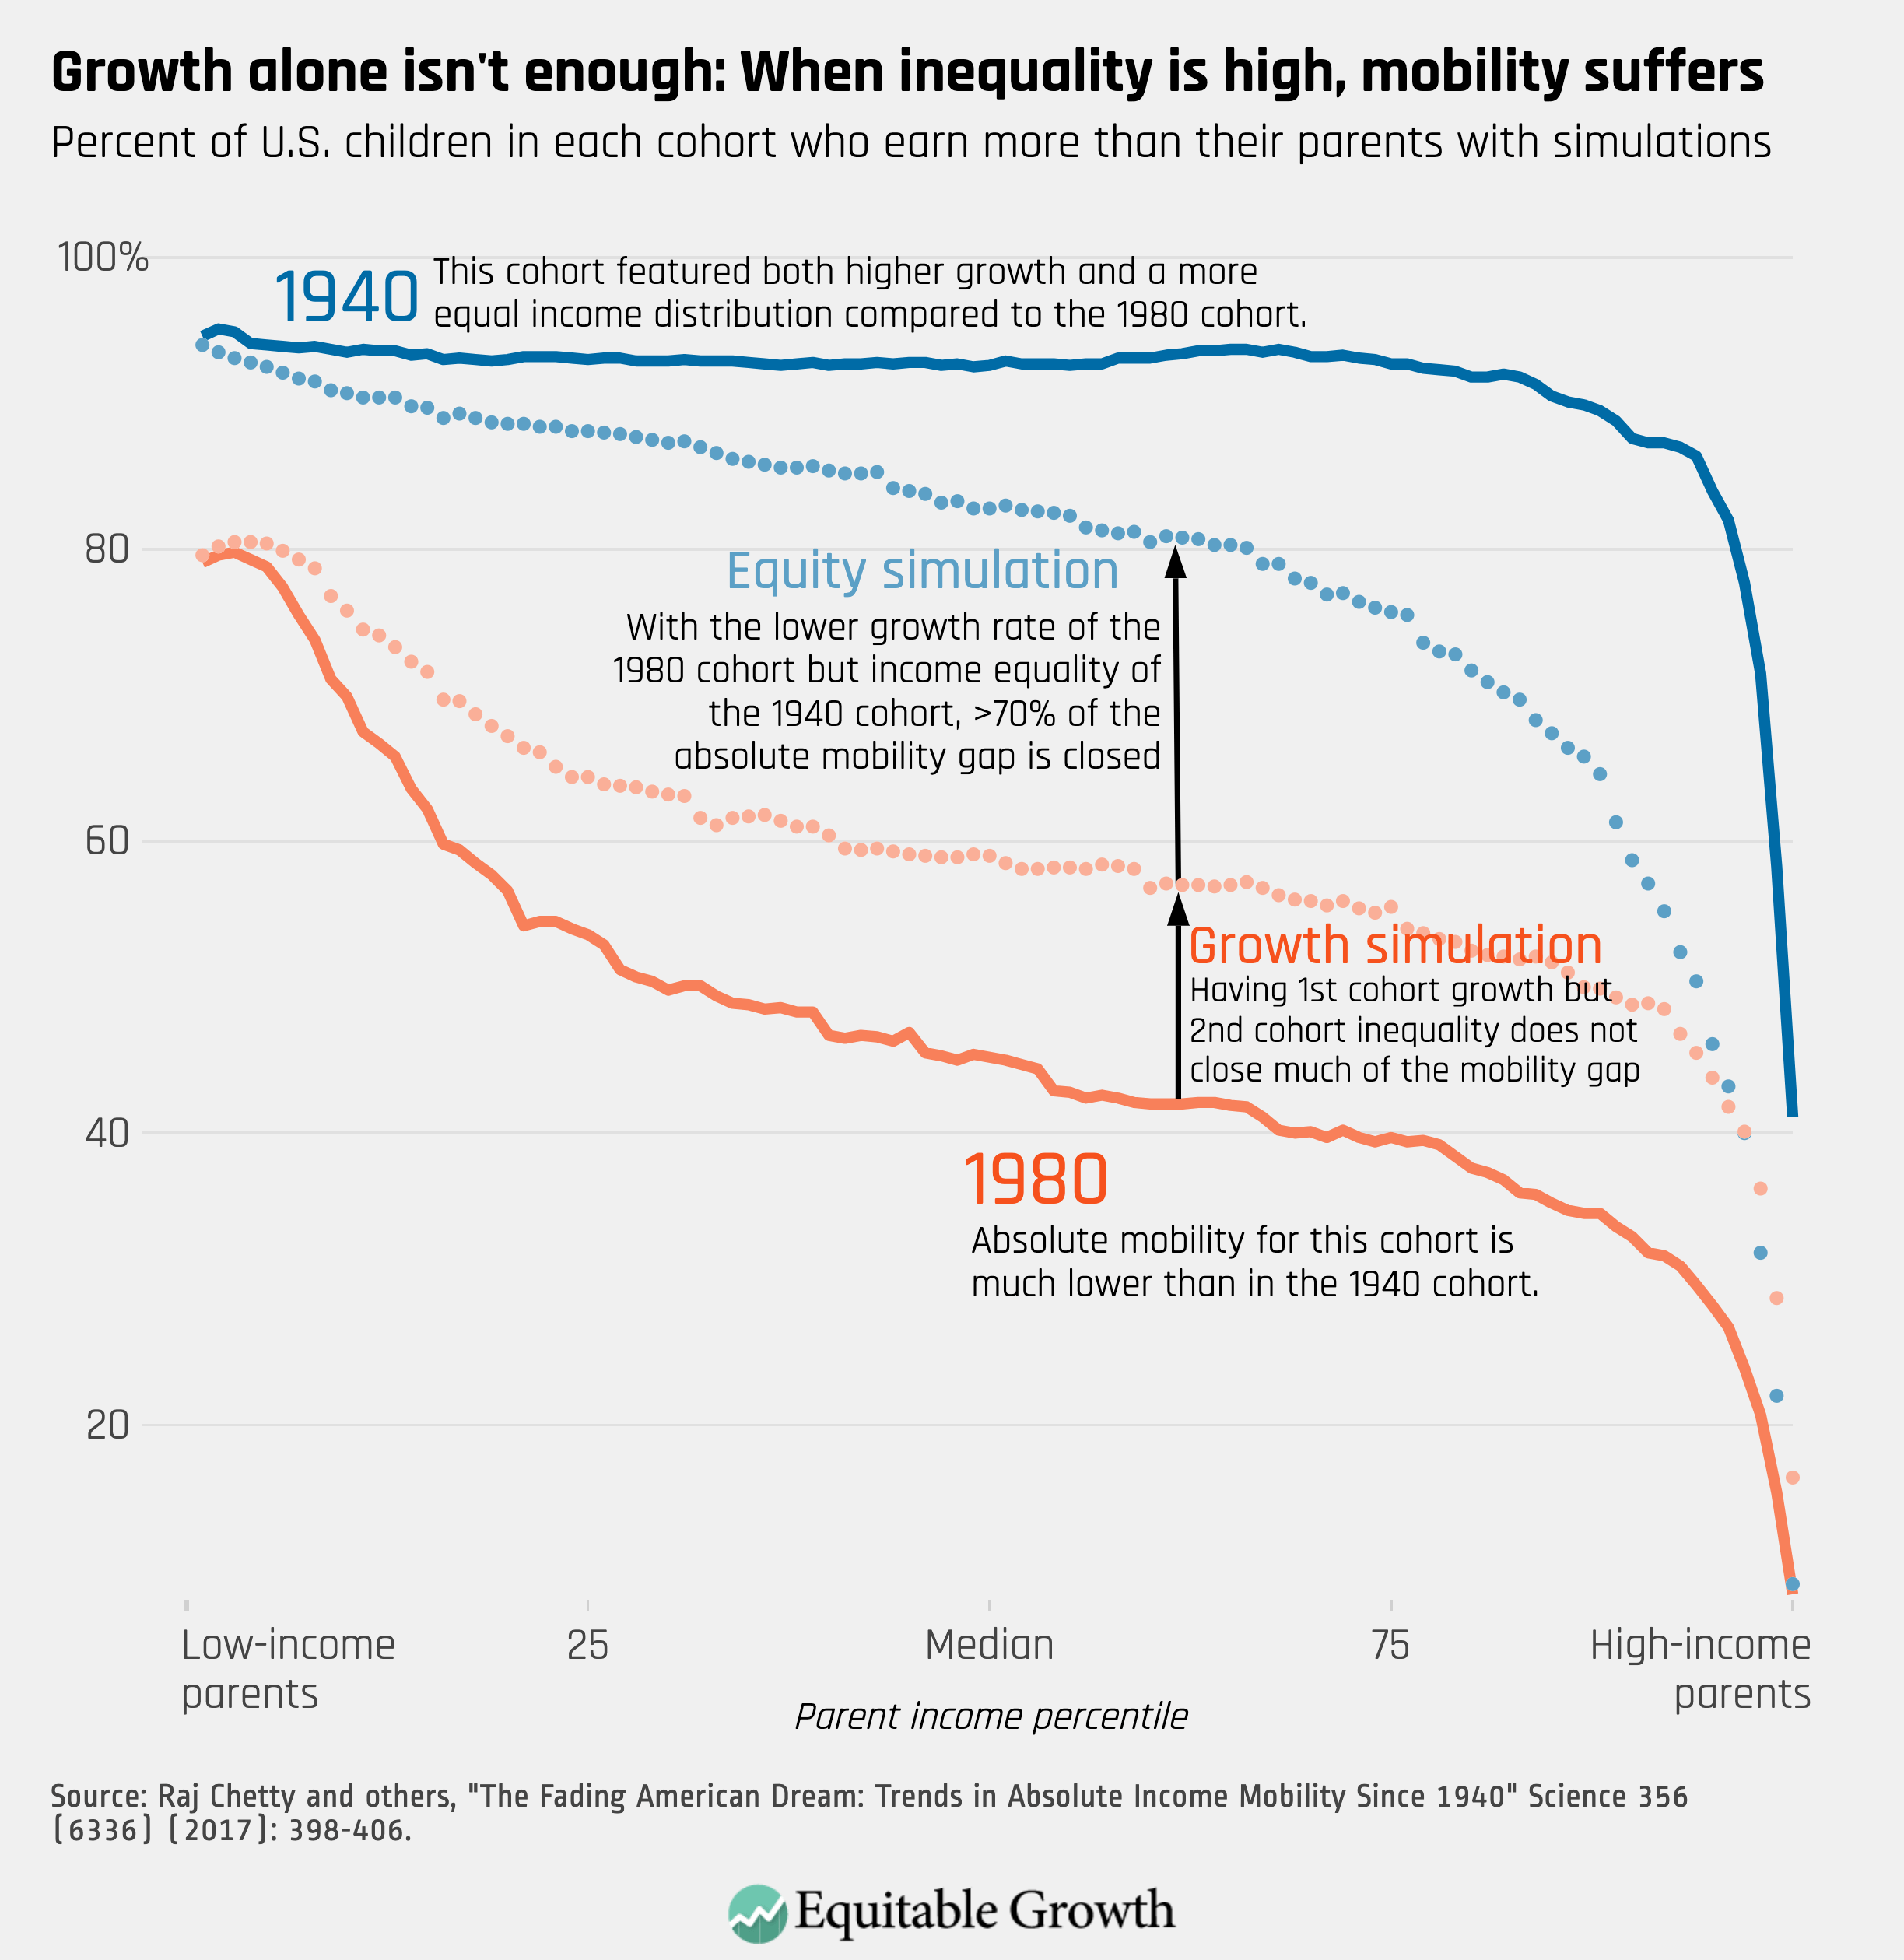
In fact, economic inequality and low economic mobility appear to occur together frequently. The next graph was first produced by City University of New York economist Miles Corak and has since been dubbed “The Great Gatsby Curve.” It demonstrates that there is a correlation between inequality and weak mobility across countries. (See Figure 6.)
Figure 6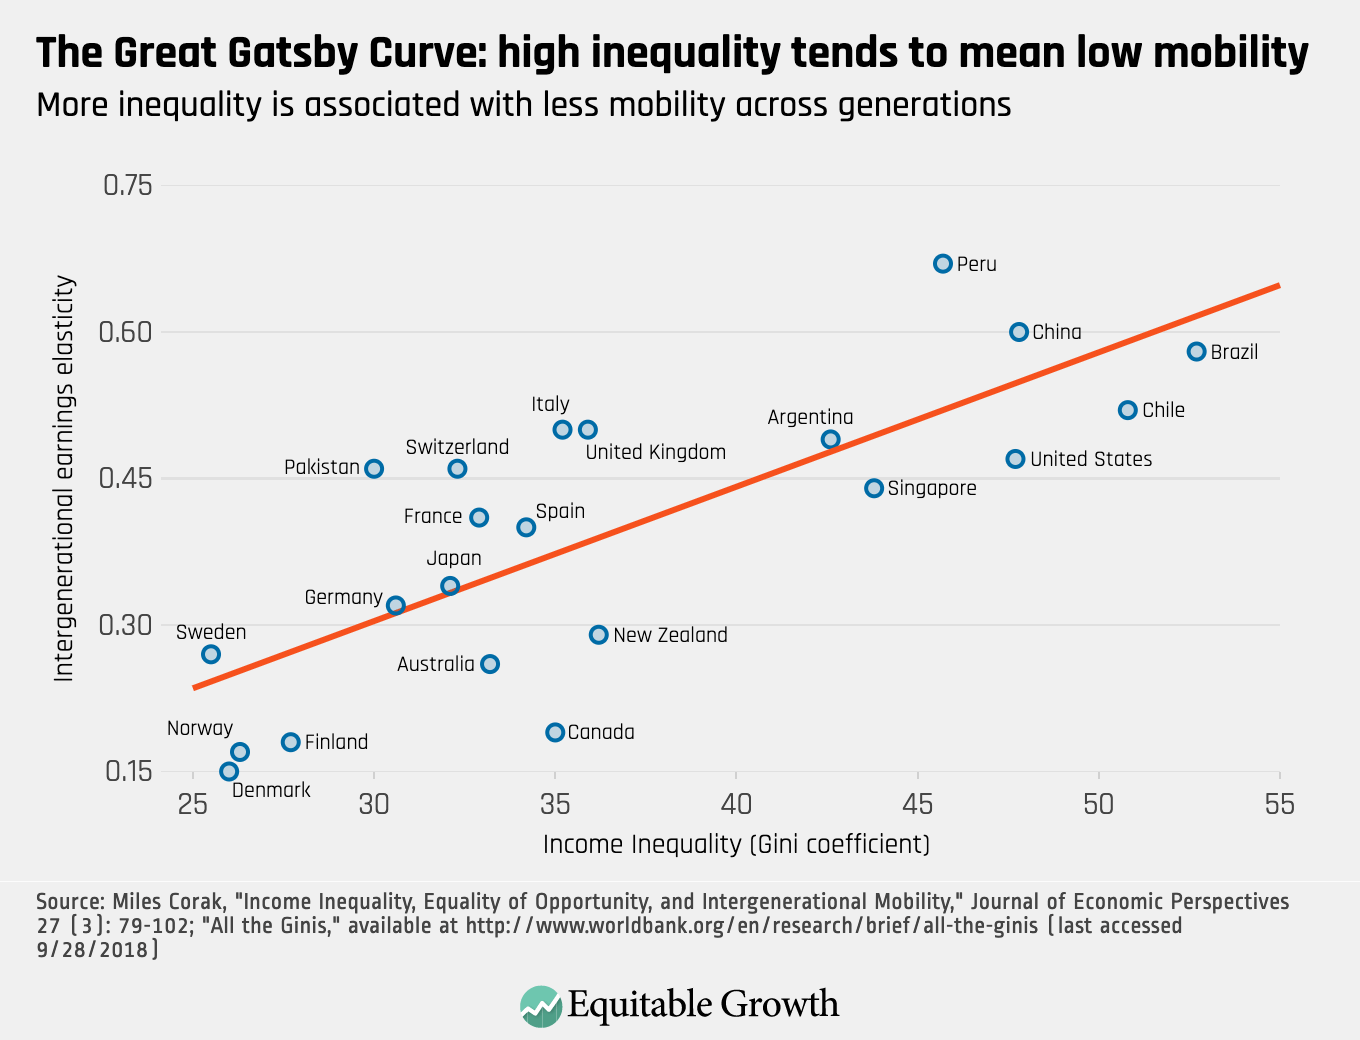
Gulfs in outcomes between the rich and poor
As economic inequality increases, the lives of the rich and poor are diverging. This is true across many metrics, but two examples are telling. First, the rich in the United States are significantly more likely to complete college, and this gap has risen with inequality. The child of a top quartile family is now 45 percentage points more likely to complete college than the child of a bottom quartile family, reinforcing the income mobility problems discussed above. (See Figure 7.)
Figure 7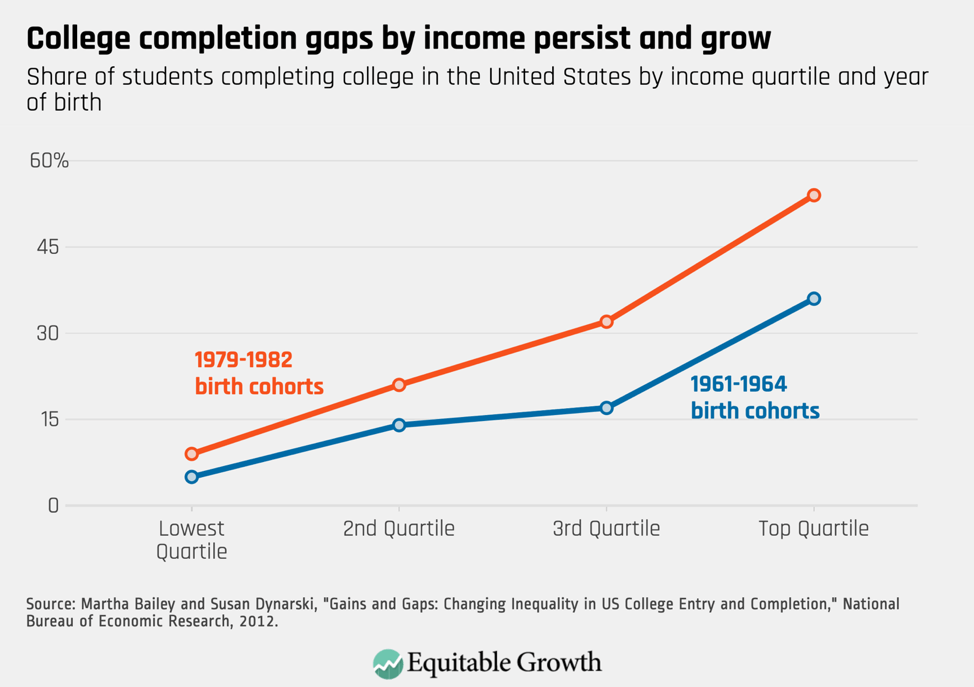
Wealth also buys a longer lifespan. Research by Raj Chetty and others shows that the gap in life expectancy between the very poorest and richest Americans is 15 years for males and 10 years for females. Notably, the gap has grown slightly for both males and females over just a 13-year period. (See Figure 8.)
Figure 8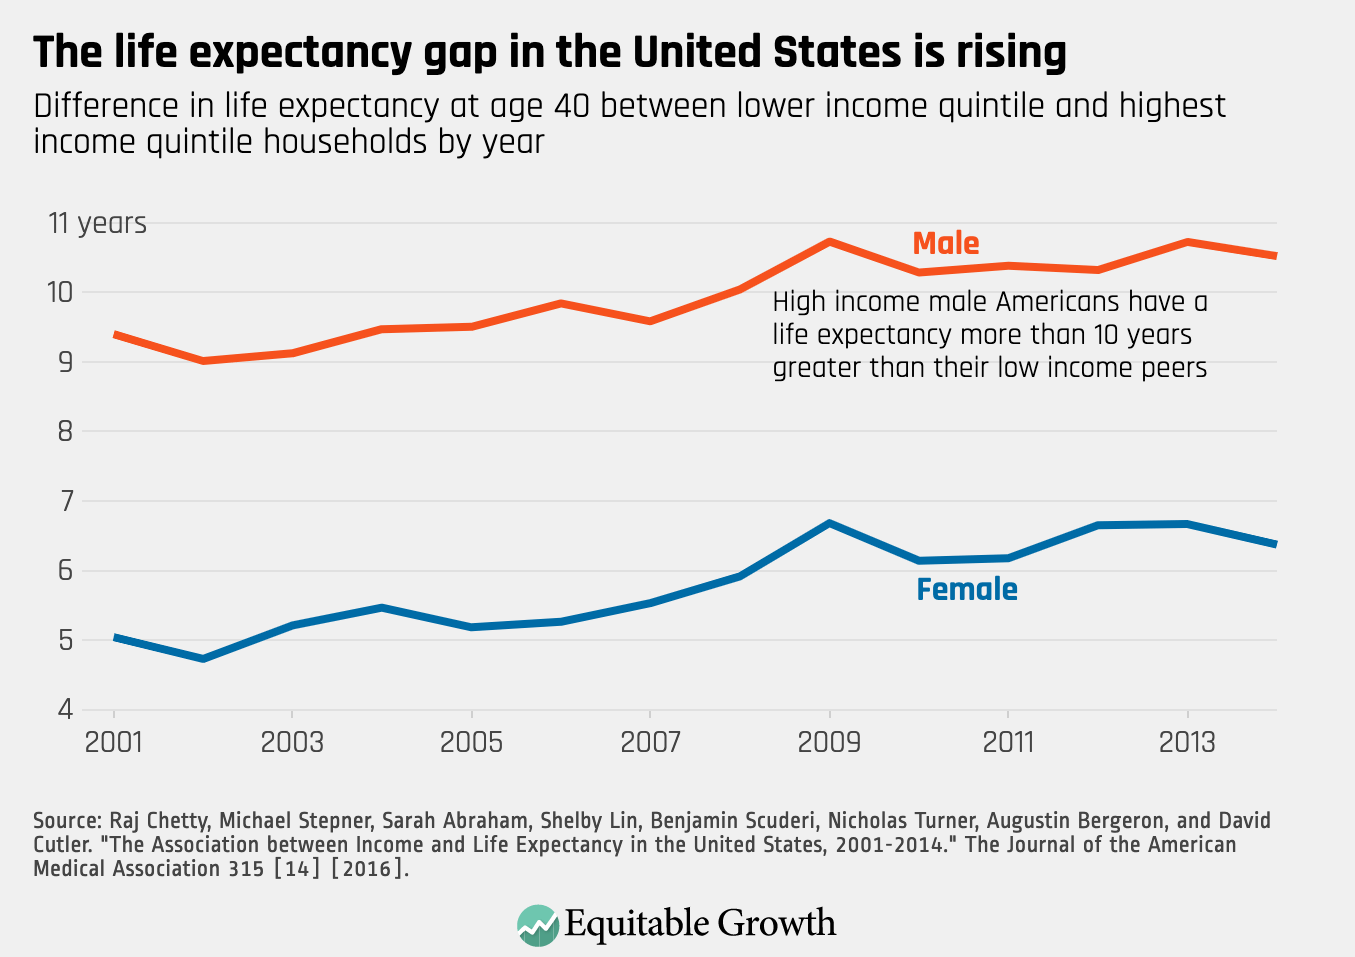
Questions about whether and how this rise in inequality affects economic growth and stability are fundamental to Equitable Growth’s work. This is why we explore how economic inequality impacts individuals and families across a wide range of issues, and what policies might address these challenges.